
See completion risk clearly.
We help teams stress-test the plan, protect returns, and focus mitigation where it matters most.
What you get
-

Vulnerability Quantified
See schedule delays & cost exposure across scenarios.
-

Key Drivers Identified
Identify threat drivers that move outcomes and focus effort fast.
-
Resilience ROI Prioritized
Compare strategies by benefit, effort, and cost-effectiveness.
-

Fast for live workshops
Run what-if iterations in real time to align the room quickly.
Outputs teams can act on
-
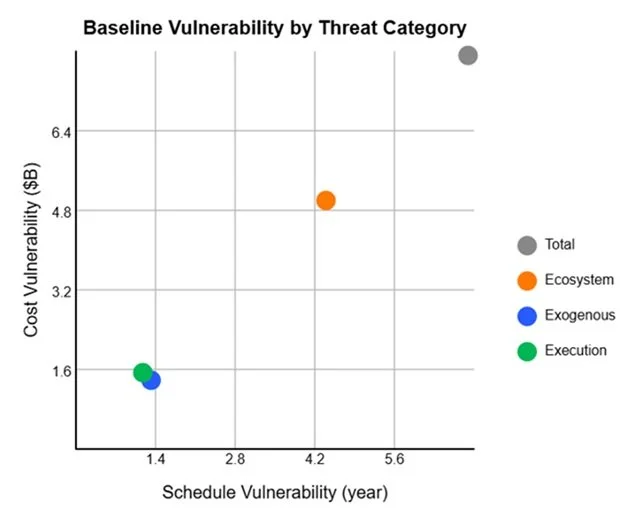
![Scatter plot titled 'Current Vulnerability by Threat Type' showing cost vulnerability in billion dollars on Y-axis and schedule vulnerability in years on X-axis. Four categories of threats are represented with colored circles: Total Threats (blue), Ecosystem Threats (orange), Exogenous Threats (blue), and Execution Threats (green).]()
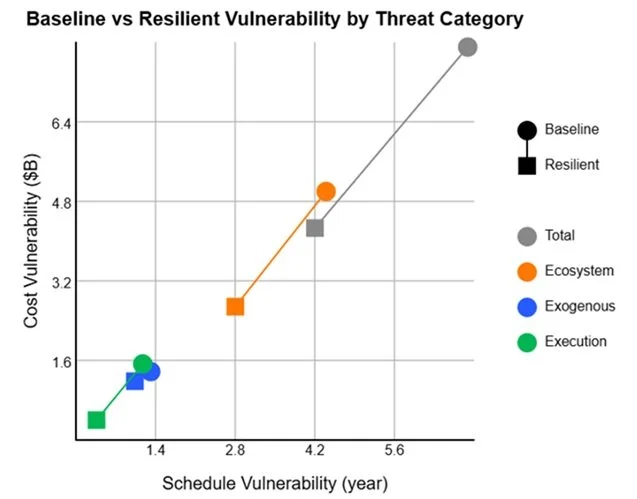
Spot Where You’re Exposed
See which threat families drive schedule vs. cost exposure while keeping both linked so the tradeoffs are real.
-
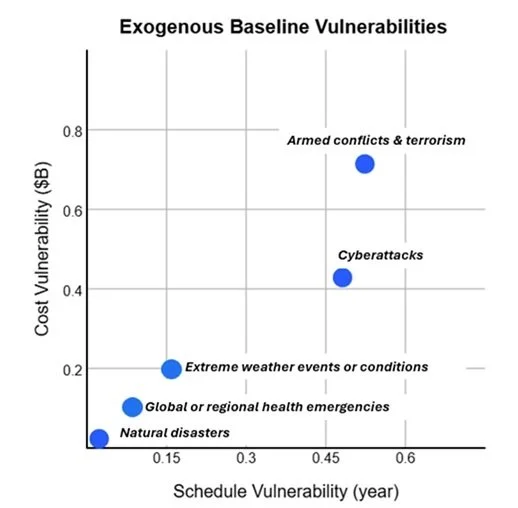
![A scatter plot chart titled 'Current Exogenous Vulnerability' showing points representing different exogenous threats, with Schedule Vulnerability in years on the x-axis and Cost Vulnerability in dollars per billion on the y-axis. The points labeled EX02 through EX05 are clustered around low vulnerability values. A legend on the right side lists five exogenous threats: severe weather trends and events, global or regional health events, armed conflicts, terrorist threats or actions, and natural disasters.]()
Pinpoint the Drivers
Move from “which bucket” to “which drivers” by identifying the specific scenarios pushing exposure inside each threat family—without losing cost/schedule linkage.
-
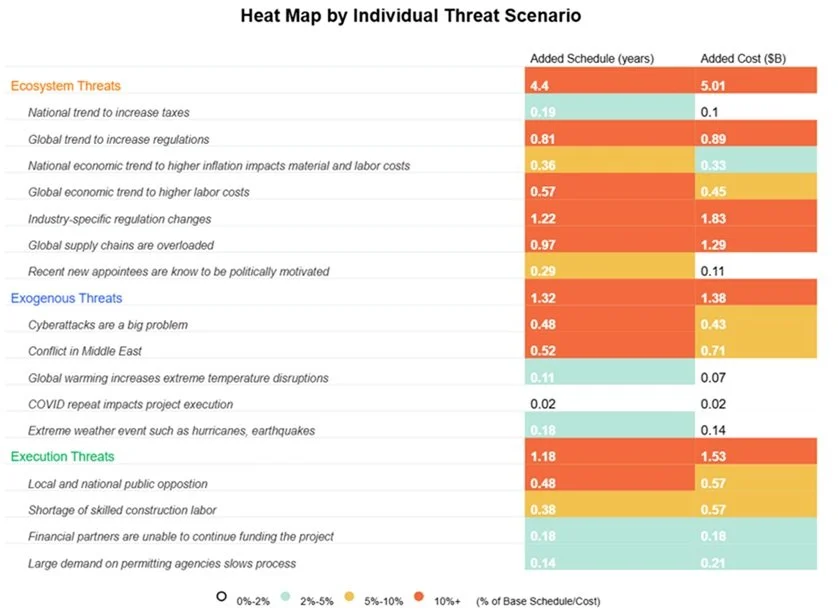
![Table listing different categories of threats along with their current vulnerability scores, added schedule in years, and added costs in billions of dollars. The threats are categorized as Ecosystem Threats, Exogenous Threats, and Execution Threats. The table includes a legend for percentage of schedule/cost vulnerability with color coding: blue, yellow, and red.]()
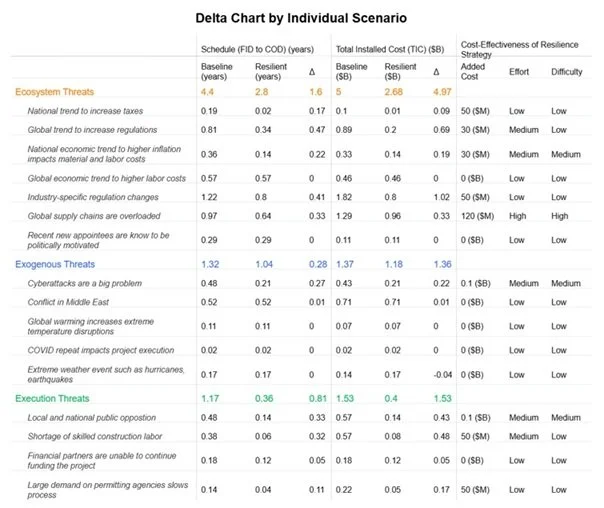
Prioritize the Biggest Moves
Start with a board-friendly roll-up of expected added schedule and cost, then drill down to what’s driving the numbers.
-
![Line graph titled 'Total Resilient Vulnerability' showing the relationship between schedule vulnerability in years on the x-axis and cost vulnerability in billion dollars on the y-axis. The graph has a red square marker at 0.2 years and a blue circle marker at 0.7 years, indicating points of vulnerability.]()
Prove the Impact of Resilience
Compare current vs. resilient outcomes to quantify how resilience actions reduce expected delay and cost exposure.
-
![Table comparing threat source vulnerabilities, costs, and strategies for ecosystem, exogenous, and execution categories, including economic, political, weather, health, conflict, disasters, and financial failures.]()
Choose What’s Worth Funding
Rank resilience strategies by impact, effort, and cost-effectiveness—so you know what to do now, what to defer, and what isn’t worth it.
Protect returns from external completion risks.
See what could break the plan and which actions reduce downside most.